
How to Measure Website Success (A UK SMB Guide)
A lot of advice about how to measure website success starts in the wrong place.
It starts with traffic charts, page views, and session counts. Those numbers are easy to find, easy to screenshot, and easy to feel good about. They’re also often the reason business owners think a website is “doing well” while the phone stays quiet, the inbox stays thin, and sales don’t move.
For most Dorset businesses, a website isn’t a media brand. It’s a sales tool, an enquiry tool, a booking tool, or a credibility tool. If it attracts visitors but doesn’t help the business win work, it isn’t succeeding in any meaningful sense.
That matters even more in the UK, where much of the advice online still leans on broad, global benchmarks. Guidance aimed at US software companies or content publishers often skips over local behaviour and regional conversion patterns. As noted in Lucky Orange’s discussion of website metrics gaps, UK-specific website success metrics for SMBs are largely underaddressed, which leaves businesses comparing themselves against the wrong standards.
Your Website Is Busy But Is It Successful
A busy shop isn’t always a profitable shop.
The same applies online. Plenty of sites get visits from people who were never likely to buy, book, call, or enquire. If you only measure volume, you can mistake noise for progress.
That’s where many website reports go off course. They tell you how many people arrived, how long they stayed, and which pages were popular. Useful context, yes. But that still doesn’t answer the only question most owners care about. Did the website help the business move forward?
Why generic advice often fails UK SMEs
A Dorset retailer, a Weymouth trades business, and a UK-wide service firm don’t all need the same reporting model. Their customer journeys are different. Their sales cycles are different. Their idea of success is different.
A local organisation may care most about event sign-ups, phone calls, or membership enquiries. A professional services firm may need fewer leads, but better ones. An eCommerce brand usually needs cleaner tracking from product view to basket to sale. Yet a lot of popular advice treats every site as if more traffic is the universal goal.
Practical rule: If a metric doesn’t help you decide what to improve next, it’s not a priority metric.
That’s the shift worth making. Stop asking whether your site is popular. Start asking whether it is useful to the business.
Define success before you open analytics
Website success should be tied to one of a few real outcomes:
- More qualified enquiries
- More completed purchases
- More bookings
- More membership or contact actions
- Better lead quality
- Stronger support for offline sales
That last point gets missed often. Many UK small businesses don’t close every sale online. Someone may discover you through Google, browse your services, leave, then call later. Another person may check your pricing page, read reviews, and walk into your shop the next day. If you only count direct online transactions, you’ll under-value what the website is doing.
The right approach is less glamorous than chasing vanity stats, but far more useful. Measure the actions that connect to revenue, enquiries, and sales conversations. Then use supporting metrics to explain why those actions are rising or falling.
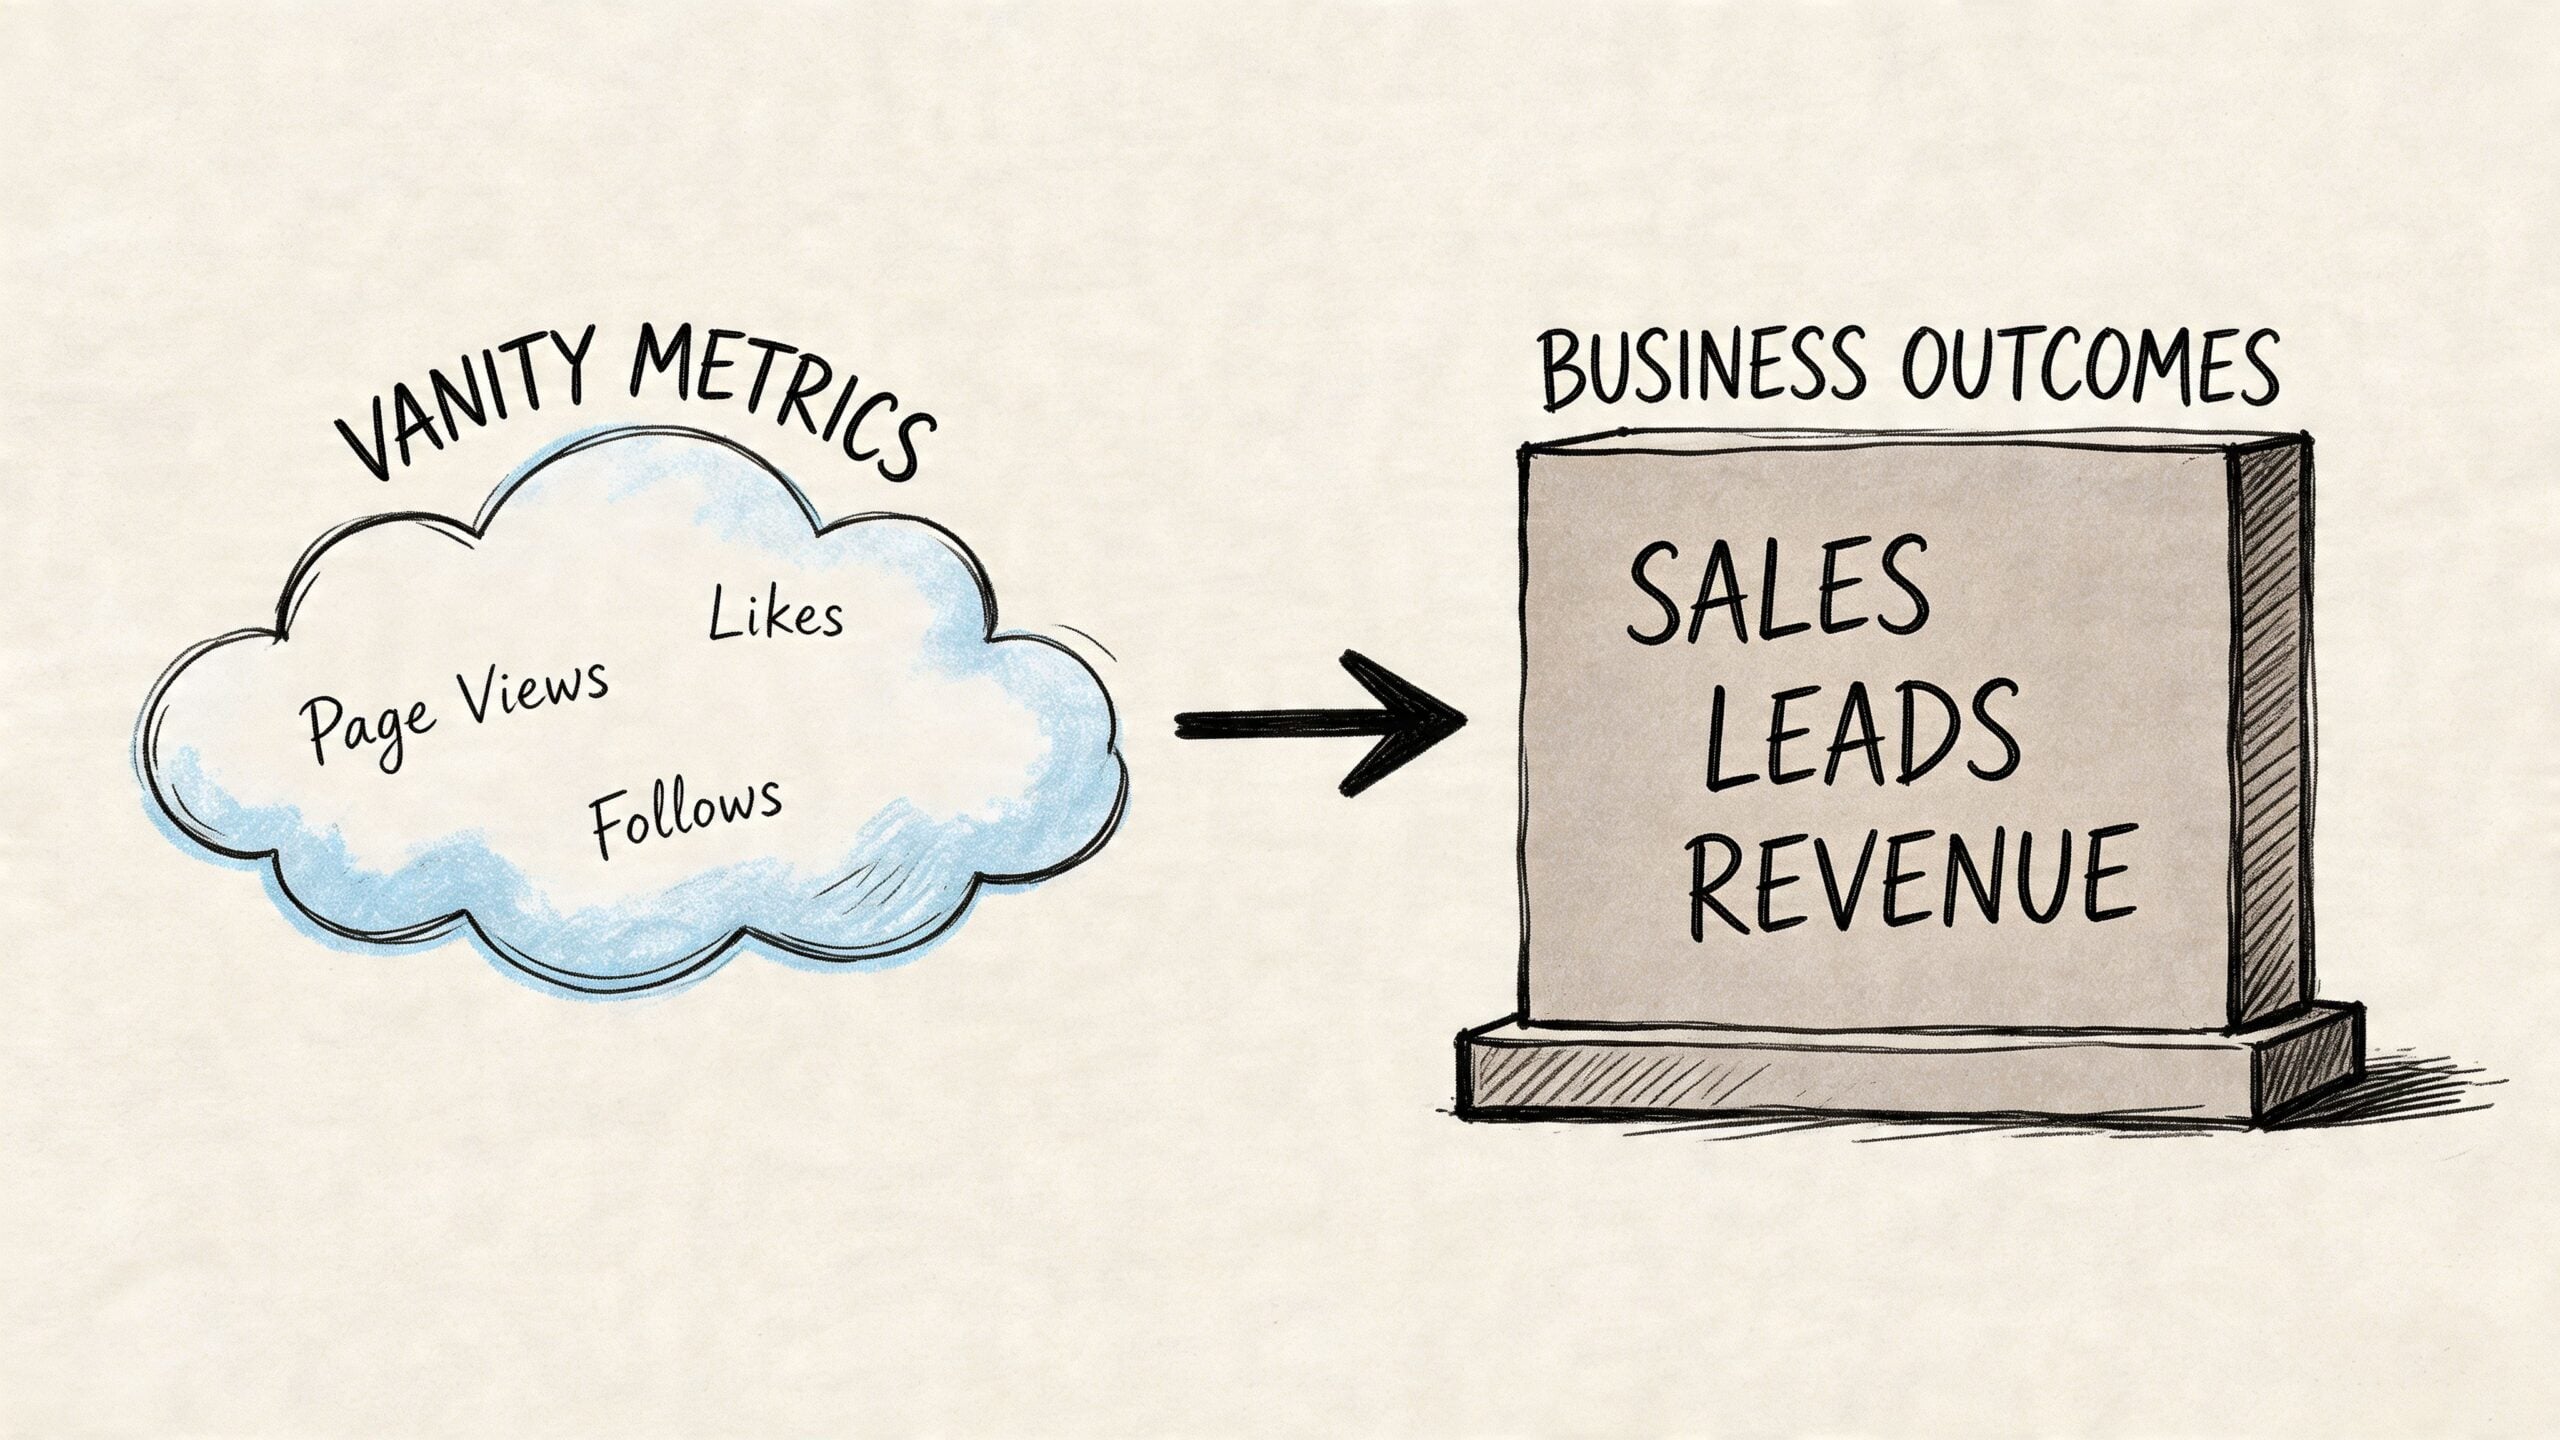
Moving Beyond Vanity Metrics to Business Outcomes
The common trap is simple. A report shows page views are up, organic traffic looks healthy, and people are spending time on the site. Everyone relaxes. Then you ask how many good leads came in, and the answer is vague.
That gap is especially important for service businesses. Optimizely’s write-up on website metrics highlights the disconnect well: most guidance focuses on engagement, but fails to capture value for professional services or B2B agencies where success means qualified leads or brand authority, not just clicks.
What vanity metrics do and don’t tell you
Vanity metrics aren’t useless. They’re just incomplete.
Page views can tell you what people are finding. Session duration can hint at interest. Social clicks can show reach. But none of them, on their own, tells you whether the site is producing value.
Here’s the trade-off:
- Traffic metrics are easy to collect, but weak at proving business impact.
- Outcome metrics are harder to set up, but they tell you whether the site is earning its keep.
A service page with fewer visits but more consultation requests is usually more valuable than a blog post with heavy traffic and no clear next step. A product page with modest traffic and steady purchases beats a homepage with lots of curiosity clicks and no conversion path.
Pick a true north metric first
Most SMEs should start with one primary success measure. Not ten.
For example:
| Business type | Better primary measure | Supporting measures |
|---|---|---|
| Service firm | Qualified enquiries | Form submissions, call clicks, booked consultations |
| eCommerce shop | Completed purchases | Basket starts, checkout progression, product page engagement |
| Local organisation | Meaningful actions | Event registrations, membership enquiries, contact actions |
Measurement achieves greater clarity. You stop asking, “How is the website doing?” and start asking, “Is the website helping people take the next step?”
A website can look active and still be commercially quiet.
A simple way to connect website actions to business value
Use this four-part check.
Name the business outcome
New leads, online sales, bookings, donations, applications, or sign-ups.Identify the website action closest to that outcome
A completed form, a booked call, a checkout completion, a click on a tracked phone number.Add two or three supporting metrics
These explain what’s helping or hurting the primary result. That might be bounce rate, landing page engagement, or form abandonment.Review quality, not just quantity
Ten poor leads can be worse than three strong ones. For service firms, this matters a lot.
What this looks like in practice
A Dorset accountant doesn’t need “more homepage traffic”. They need the right businesses filling in the enquiry form or calling after reading the services page.
A local retailer doesn’t just need users browsing products. They need shoppers moving from category pages into basket and through checkout.
A community organisation may care less about average session time and more about whether visitors can quickly find opening times, event details, or membership information.
That’s the practical answer to how to measure website success. Track what reflects a real commercial or organisational result. Let traffic and engagement sit in the background as supporting evidence, not the main headline.
Aligning Website KPIs with Your Business Type
One of the most useful shifts for UK SMEs is choosing KPIs by business model rather than copying a generic dashboard.
A balanced view usually works better than a single metric obsession. Morpht’s balanced approach to measuring website success gives a sensible framework for UK SMEs, including benchmarks such as bounce rate below 40%, eCommerce conversion rate of 2.5-3.5%, and cost per acquisition below £50. Those figures are far more practical for small businesses than broad “growth” talk with no commercial context.
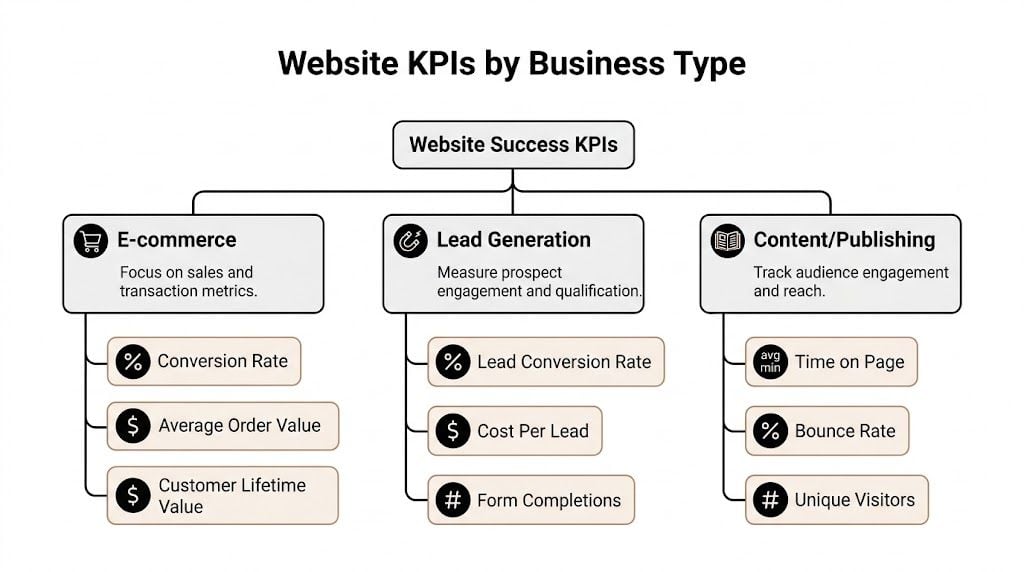
Key Website KPIs by Business Type
| Business Type | Primary Goal | Primary KPIs | Secondary KPIs |
|---|---|---|---|
| eCommerce | Sales | conversion rate, completed purchases, cost per acquisition | bounce rate, checkout drop-off, page speed |
| Professional services | Qualified leads | enquiry submissions, booked calls, cost per lead | landing page engagement, form abandonment, call clicks |
| Local or community organisations | Useful actions | contact actions, registrations, membership enquiries | key page visits, navigation behaviour, mobile usability |
For eCommerce businesses
If you run an online shop, your website has a direct job. Sell products profitably.
That means your primary KPI set should stay close to revenue-producing behaviour. The broad benchmark for UK eCommerce conversion rate is 2.5-3.5% within the balanced scorecard source above, which gives you a more realistic frame than global advice that ignores local market conditions.
Useful priorities for an online shop include:
- Completed purchases: Your clearest outcome metric.
- Conversion rate: A fast way to spot whether merchandising, trust, or UX is getting in the way.
- Cost per acquisition: Keep this under control so growth doesn’t become expensive growth.
- Bounce rate: If shoppers land and leave, the issue may be message match, design clarity, or speed.
If your bounce rate is high and your conversion rate is low, don’t jump straight to paid ads. Check the product page first. Look at imagery, delivery information, return details, and mobile usability. A good traffic source can’t rescue a poor buying experience.
For product-led brands, category and product page performance matters more than homepage vanity. If you’re working on shop performance, our guide on running a successful online store covers the commercial side of that work.
For professional services firms
Most service firms don’t need more leads. They need more relevant leads.
That changes the KPI mix. A solicitor, consultant, architect, coach, or agency should judge the site by whether it produces enquiries from the right kind of client.
A practical setup usually includes:
- Primary KPI: Enquiry submissions or booked consultations
- Secondary KPI: Cost per lead
- Supporting quality checks: Which service pages produce leads, which traffic sources send the best prospects, and where users drop off before submitting
Here, volume can mislead badly. A campaign might increase form submissions while lowering lead quality. That’s why service businesses should look at lead source and lead intent alongside the form completion itself.
Don’t reward the website for generating contacts your sales team doesn’t want.
Another useful lens is page purpose. Your about page may reassure people. Your services page may persuade them. Your contact page should remove friction. If one of those pages underperforms, the whole lead journey weakens.
For local and community organisations
A local chamber, charity, club, venue, or member organisation often has a different success model again. The website may exist to help people find information quickly, register interest, or take part.
In that case, the strongest KPIs often look like this:
- Contact or registration actions
- Visits to high-intent pages
- Mobile usability on key pages
- Search visibility for local terms
- Navigation paths to important information
This kind of site can perform well without huge traffic. If residents or members can quickly find what they need and take the intended action, the website is working.
A simpler balanced scorecard for SMEs
The balanced scorecard idea sounds more complicated than it is. In practice, it means you don’t judge success from one angle only.
A workable version for a small business includes four categories:
User metrics
Start with behaviour. Is the site easy to use? Is bounce rate under control? Are people completing important tasks?Financial metrics
Look at cost per lead, cost per acquisition, or direct online revenue, depending on your model.Operational metrics
A site that loads slowly or breaks forms can wreck results before any marketing starts.Internal process metrics
Can your team update content quickly? Are new landing pages going live without delays?
The essential tracking to set first
Don’t set up dozens of events on day one. Start with the handful that matter.
- Track form submissions: This is often the primary conversion for service firms.
- Track phone and email clicks: Especially useful for local businesses that convert offline.
- Track key CTA clicks: Quote requests, booking buttons, brochure downloads.
- Track thank-you page visits: A simple back-up method for confirming completed enquiries.
- Track purchase and checkout steps: Essential for online shops.
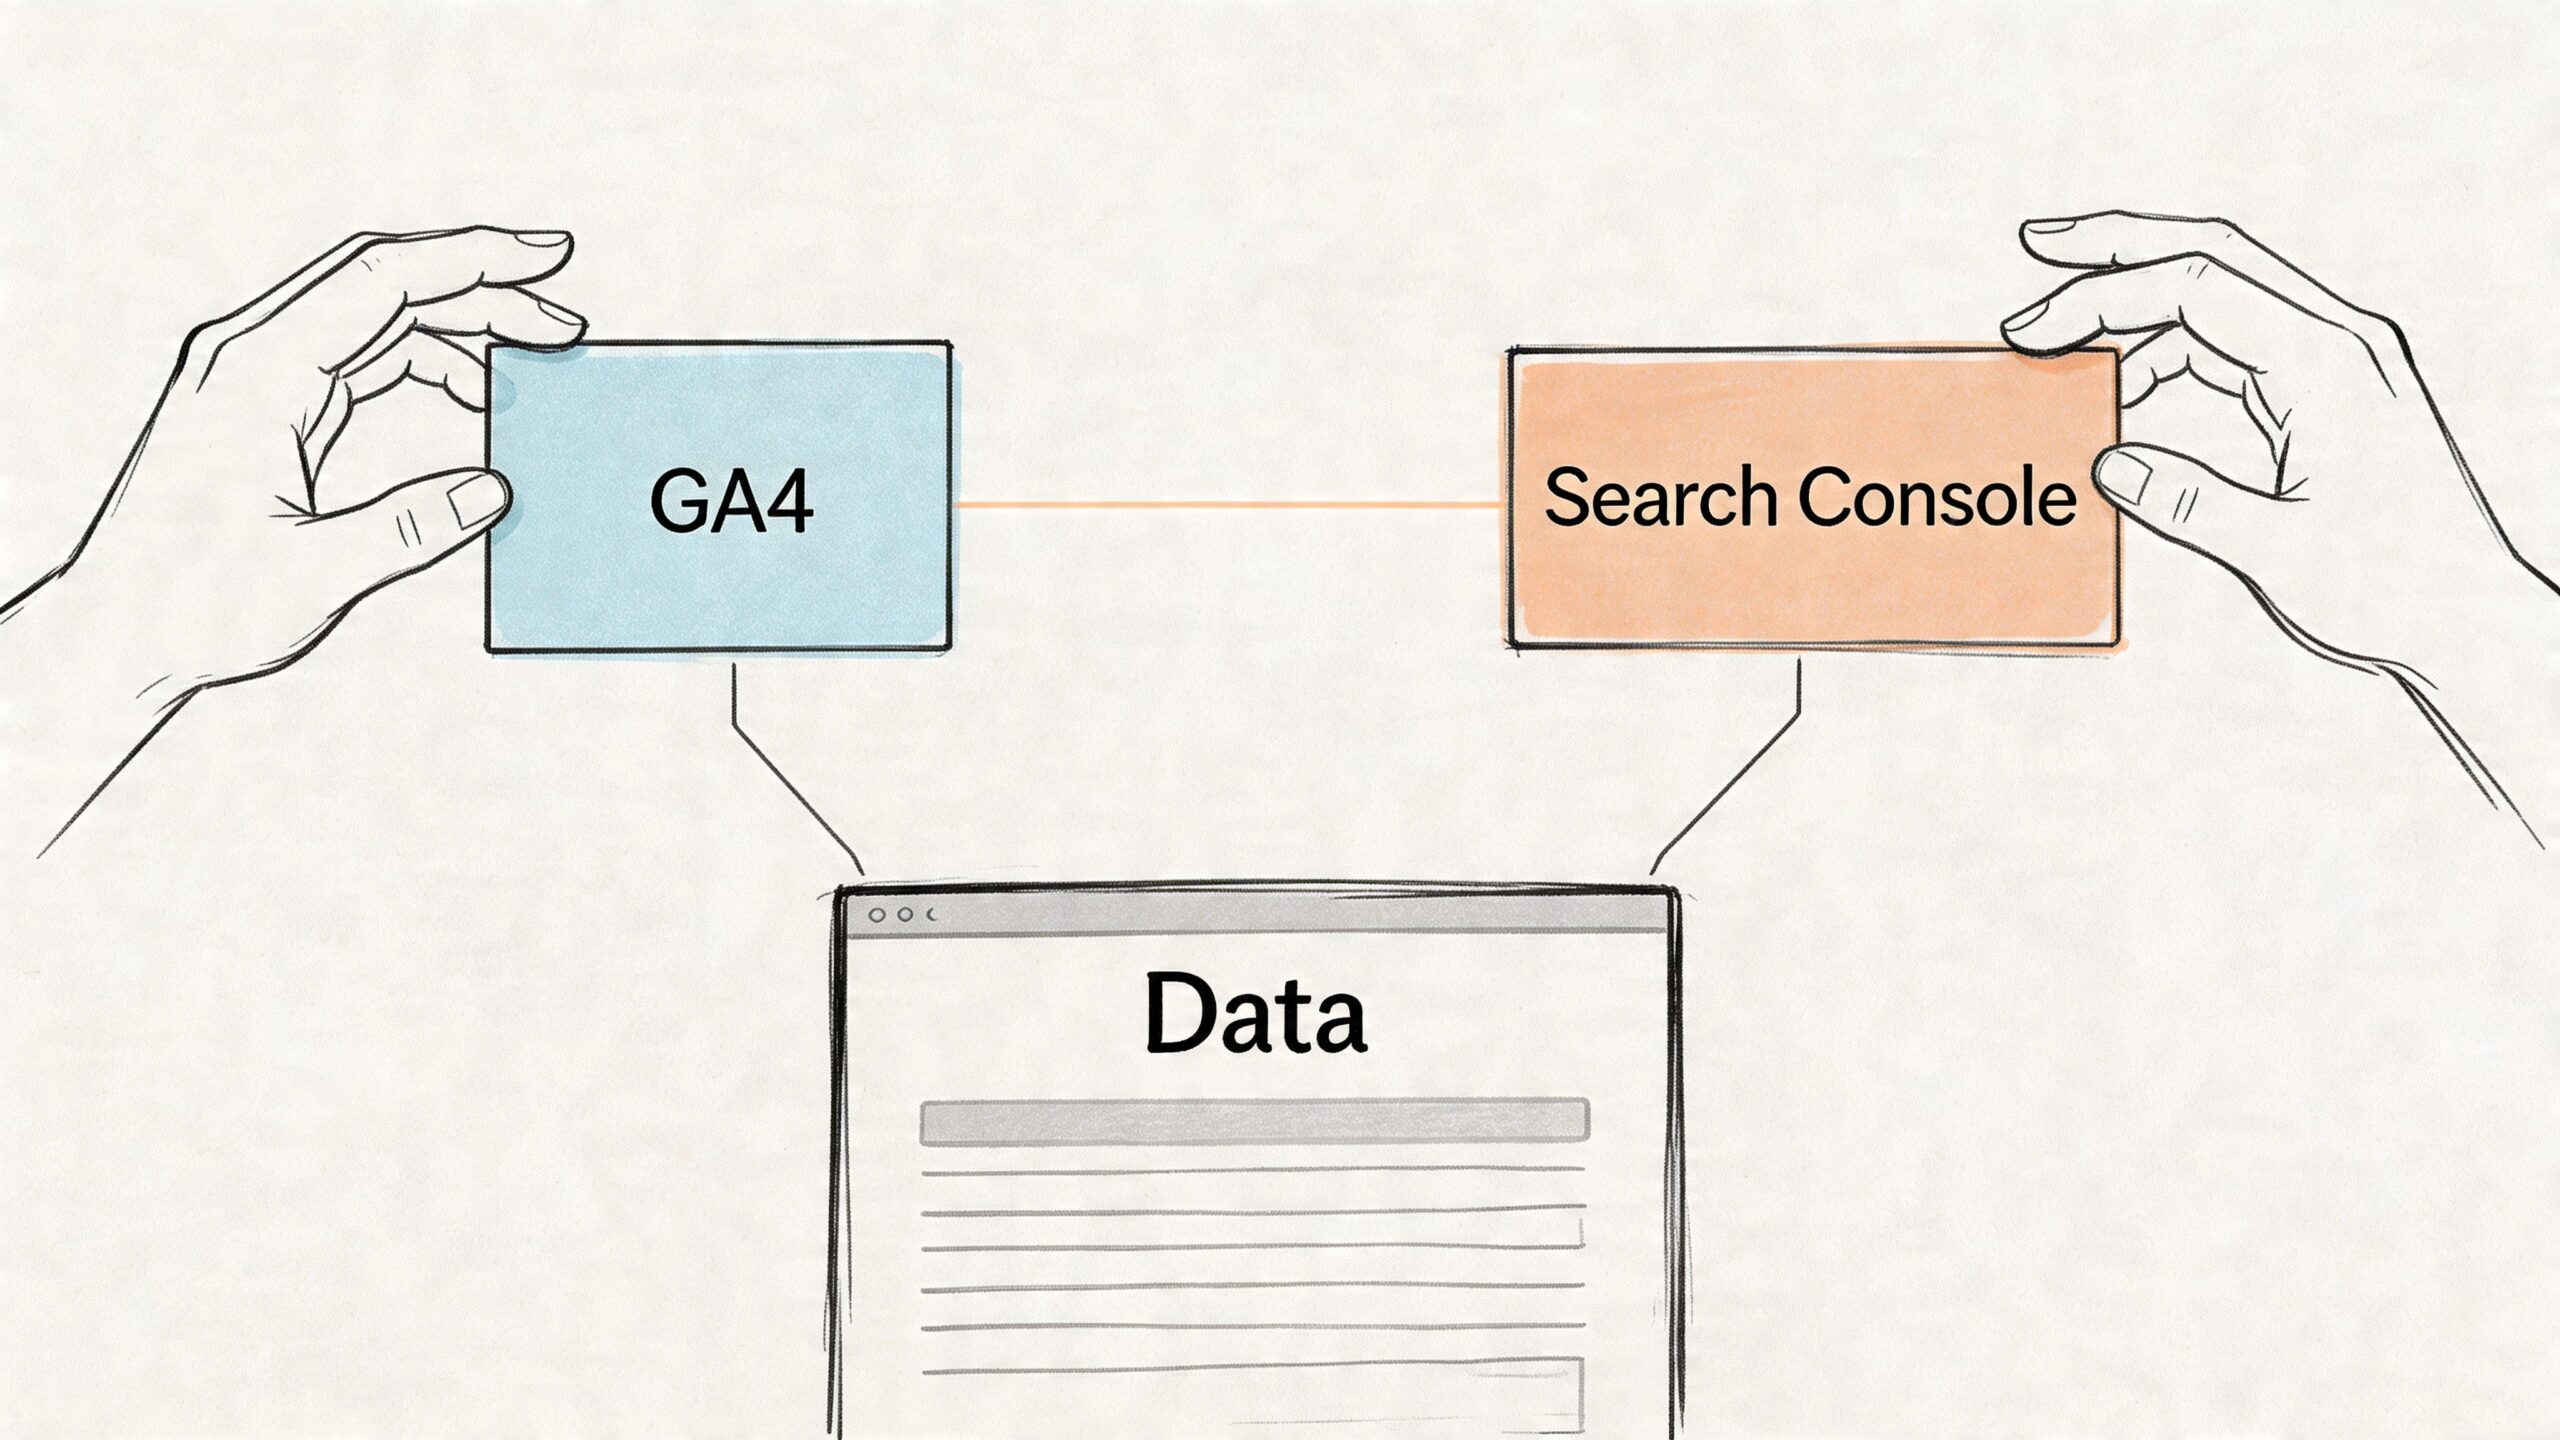
- Use Search Console alongside GA4: Search demand and on-site behaviour tell a stronger story together than either tool alone.
Dashboards often improve. Not by adding more numbers, but by tying each number to a business action that matters.
Setting Up Your Measurement Toolkit
A decent measurement setup doesn’t need to be complicated. It needs to be intentional.
Most SMEs can get what they need from Google Analytics 4, Google Search Console, and one sensible event-tracking plan. If you’re on WordPress, that setup is usually straightforward. If you’re on Shopify or a more customised platform, tag management needs a bit more care. For store owners dealing with platform-specific tracking, AliSave Pro's guide to GTM on Shopify is a useful reference because it focuses on implementation rather than theory.
Start with the customer journey
Before touching settings, map the path you want someone to take.
The strongest measurement plans begin with the journey from first visit to final action. American Eagle’s measurement strategy guide points to this directly for conversion-focused UK WordPress sites, including KPI examples such as form abandonment below 20% and cost per lead below £30 when benchmarked against UK averages.
Write your own version in plain English:
- Discover the site through search, social, referral, or paid traffic
- Land on a key page
- Read enough to judge relevance
- Click a CTA
- Complete a form, make a purchase, or contact the business
If that path isn’t clear on paper, it won’t be clear in your reports either.
The practical five-step setup
For most businesses, this gets you the majority of the value without analytics bloat.
Verify Google Search Console
This shows what people searched for, which pages appear in search, and where visibility is improving or dropping.Install GA4 correctly
Don’t stop at basic pageview tracking. Make sure GA4 is connected site-wide and tested on real pages.Set up only your critical events
Focus on form submissions, CTA clicks, phone clicks, email clicks, checkout steps, and purchases. Skip the vanity event clutter.Mark the right conversions
In GA4, designate only the actions that matter commercially. Not every click deserves conversion status.Test your setup yourself
Submit the form. Click the phone number. Complete a test purchase if appropriate. If you don’t verify events manually, you’re trusting data you haven’t checked.
If analytics is installed but your key actions aren’t tracked, you don’t have measurement. You have decoration.
What to track by site type
Different sites need different event priorities.
For a service business:
- Form submission event
- Call click event
- Email click event
- Brochure or proposal download
- Appointment booking click
For an online shop:
- Product view
- Add to basket
- Begin checkout
- Purchase
- Coupon or promo interaction if relevant
For a local organisation:
- Membership form completion
- Event registration
- Volunteer enquiry
- Map or directions click
- Key document download
If you use WordPress and want a more guided route into reporting and event setup, DesignStack also publishes a practical GA4 resource at this Google Analytics 4 guide.
Avoid the common setup mistakes
The biggest issue isn’t usually missing tools. It’s misleading data.
Watch for these problems:
- Misattributed conversions: If someone returns later through another channel, the wrong source may get the credit.
- No distinction between micro and primary conversions: A button click and a completed lead form shouldn’t carry equal weight.
- Unclear naming conventions: If events are messy, reports become harder to trust.
- No postcode or regional segmentation when needed: Local businesses often benefit from seeing where enquiries are coming from within their actual service area.
A short explainer can help if you’re setting this up for the first time:
Build one monthly report you’ll actually read
Once the tools are live, keep reporting simple.
A useful monthly report for an SME usually includes:
- Primary outcome metric: sales, leads, bookings, or registrations
- Top traffic sources
- Best landing pages
- Conversion rate on key pages
- Any obvious friction points: such as drop-offs on forms or weak mobile engagement
- One action to take next month
That last line matters most. If a report doesn’t lead to a decision, it becomes admin.
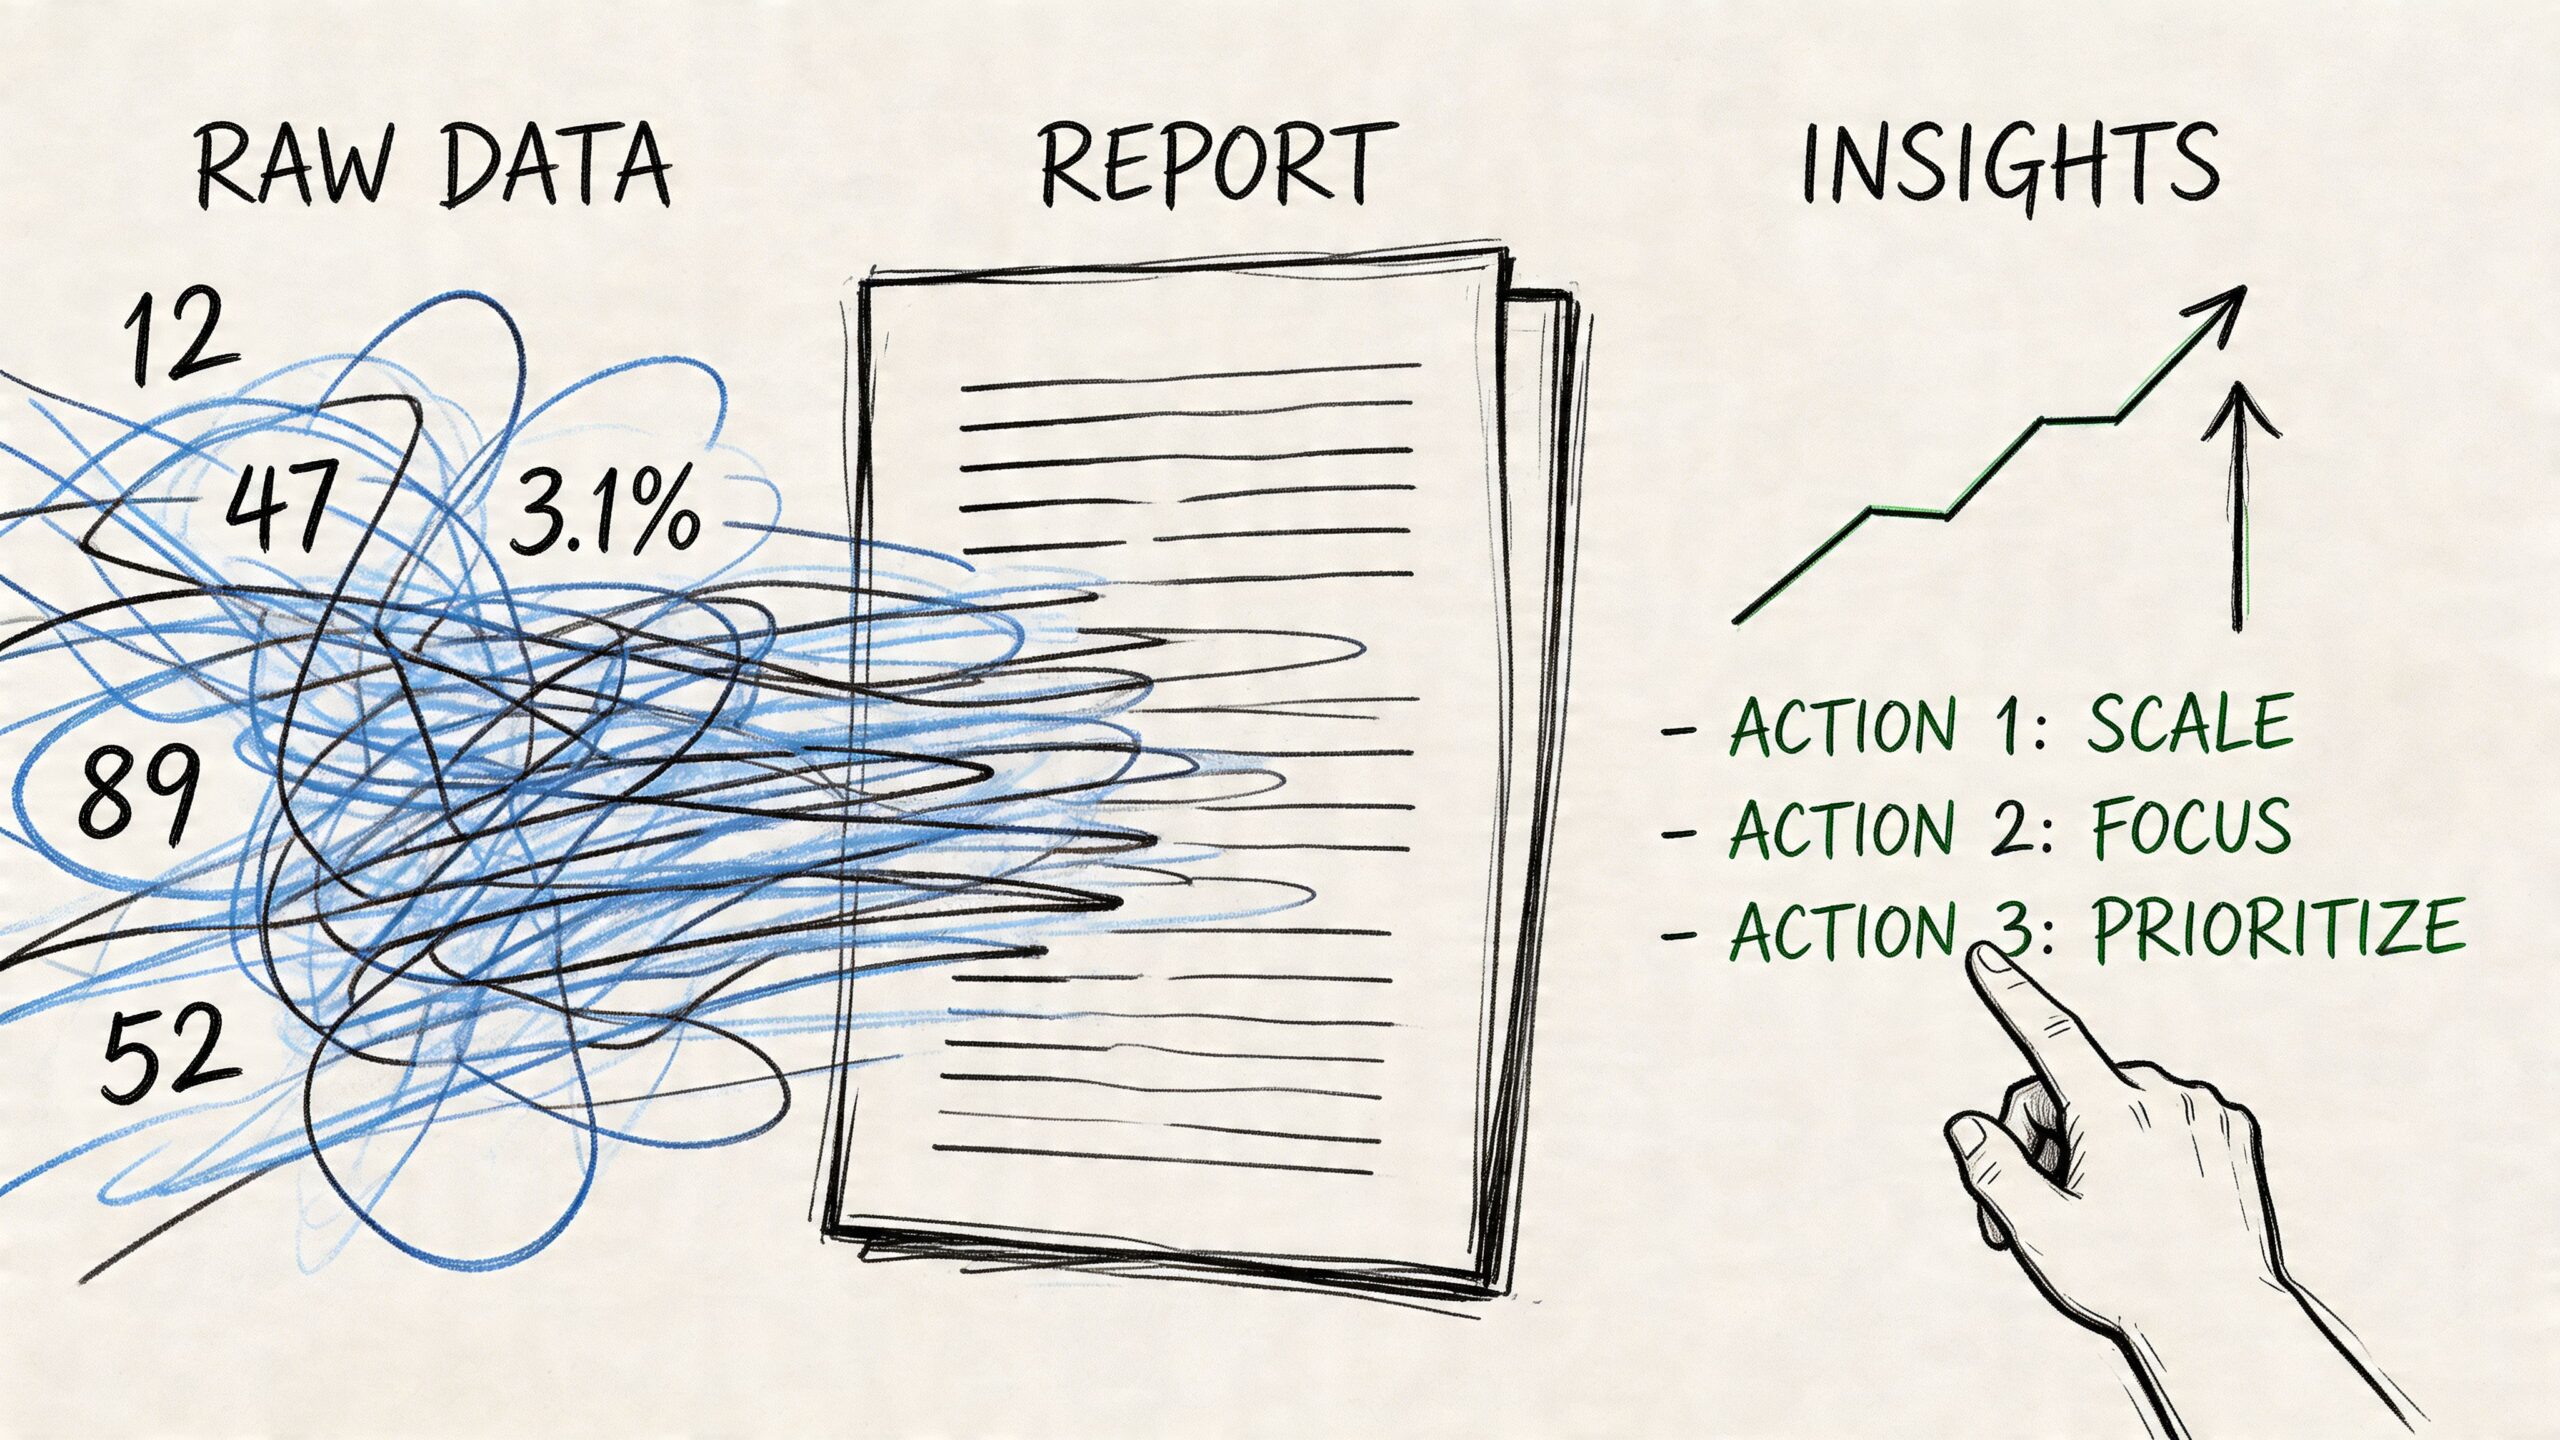
Building Reports That Actually Inform Decisions
Most website reporting fails because it answers the wrong question.
It says what happened, but not what to do next. A business owner doesn’t need more charts. They need a short, reliable view of whether the website is helping or hurting commercial performance.
Read metrics in groups, not in isolation
A single metric rarely means much alone.
For example, rising search visibility can look positive, but if enquiries fall at the same time, something on the landing page or offer may be weakening conversion. Good reporting connects those dots.
A practical dashboard should bring together:
- Demand signals from Search Console
- Behaviour signals from GA4
- Outcome signals from your tracked conversions
That combination gives you usable stories, such as:
- Organic visibility is improving, but key pages aren’t converting
- Paid traffic is landing well, but contact intent is weak
- One service page attracts fewer visits, but better leads
- Mobile users are reaching the page, then dropping before the action step
A one-page monthly report template
Keep it short enough to review in a quarter of an hour.
Use sections like these:
| Report area | What to include | What to ask |
|---|---|---|
| Outcomes | leads, sales, bookings, registrations | Did the site create business value this month? |
| Acquisition | main channels and top landing pages | Which sources brought relevant visitors? |
| Behaviour | engagement on key pages and journeys | Where did people hesitate or leave? |
| Technical issues | broken forms, slow pages, tracking gaps | Did anything block performance? |
| Next action | one priority change | What are we improving next? |
This is also where simple dashboards in GA4 or Looker Studio help. They’re useful when they remove noise, not when they pile on widgets.
Good reporting narrows your focus. It shouldn’t widen your confusion.
Turn reports into decisions
Once the report is visible, the next question should be practical.
If search impressions rise but conversions don’t, review the landing page message. If enquiry volume rises but quality drops, tighten the CTA or qualify the form. If one channel sends traffic that never engages, reduce effort there and invest elsewhere.
For many SMEs, this is also the right point to review the website itself through an SEO and UX lens. A structured SEO audit often helps identify why traffic and conversion aren’t lining up, especially when rankings improve but commercial results lag behind.
Keep A/B testing simple
You don’t need an enterprise testing programme to improve performance.
Start with one question at a time:
- Is the CTA too vague?
- Is the form too long?
- Does the page ask for action too early?
- Is the mobile layout making key information harder to find?
Then test a sensible change. Compare the old version and the revised one over a meaningful period. Keep notes. Don’t test five things at once, or you won’t know what caused the result.
The point of reporting isn’t documentation. It’s action.
From Data to Decisions Running Tests and Iterating
A website shouldn’t be treated like a brochure that goes live and then sits untouched.
The better model is a cycle. Measure what matters. Spot where users struggle. Make one improvement. Check the result. Repeat.
Use a simple hypothesis
The easiest way to start is with a sentence that forces clarity:
We believe changing this part of the page will improve this business outcome for this type of visitor.
That could mean:
- changing the main CTA on a service page
- shortening an enquiry form
- moving trust signals higher up
- simplifying a product page on mobile
- creating a more direct landing page for a specific service
This doesn’t need a formal testing team. A small business can often learn a lot just by making a deliberate change and reviewing the same KPI before and after.
Test small, not dramatic
Big redesigns create too many moving parts. Small changes are easier to judge.
Try changes like these:
- CTA wording: “Submit” is weaker than a benefit-led action.
- Form length: Remove fields that don’t help qualify the lead.
- Page order: Put pricing guidance, FAQs, or trust elements earlier if users need reassurance.
- Navigation choices: Too many options often reduce action.
- Local proof: A Dorset business may convert better with recognisable place references and relevant examples.
Keep a record of what you changed
This part sounds dull, but it’s what stops businesses from guessing.
Maintain a simple log with:
- the page changed
- the date
- the hypothesis
- the KPI being watched
- the result after review
Over time, this becomes far more useful than a pile of disconnected analytics snapshots. You start to learn what your audience responds to.
The value in learning how to measure website success is that measurement stops being passive. It becomes the basis for steady improvement.
Start Measuring What Matters Today
The strongest websites rarely win because they have the prettiest dashboard. They win because the business behind them knows what success looks like and tracks it properly.
That means moving past vanity metrics. It means choosing KPIs that match your business model. It means setting up GA4 and Search Console around real customer actions, not just generic engagement. And it means using reports to make decisions, then testing small improvements over time.
If you take one thing from this guide, let it be this: website success is not traffic by itself. It’s the extent to which your site helps generate leads, sales, bookings, or the right kind of enquiry.
Pick one primary KPI this week. Just one.
If you’re a service business, that might be completed enquiry forms. If you’re an online shop, it might be completed purchases. If you’re a local organisation, it might be registrations or contact actions.
Track that properly first. Then build from there.
If you want a clear view of what your website should be measuring, DesignStack can help map the right KPIs, review your current setup, and identify where your site is generating activity but not enough business value.


Leave a Reply