

Conversion Rate Optimization Services
In Great Britain, ecommerce conversion fell from about 2.18% in Q4 2023 to about 1.94% in Q4 2024, according to UK ecommerce market data reported by StoreBuilder. That drop is small enough to ignore in a monthly dashboard, but serious enough to affect orders, enquiries and profit when your traffic stays steady.
That's why conversion rate optimization services deserve a more rigorous starting point than “make the buttons green”. Before changing copy, layouts or checkout fields, a Dorset business needs to establish what its conversion rate measures, which visitors are being counted, and where the commercial friction sits. A good CRO partner improves the path from visit to sale or enquiry. A weak one produces attractive reports and a queue of unproven ideas.
Table of Contents
- Why UK SMBs Are Losing Conversions Right Now
- What Conversion Rate Optimisation Services Include
- The Denominator Problem Nobody Talks About
- How a CRO Engagement Runs From Audit to Test
- Proving ROI With Numbers a Dorset SMB Can Audit
- Pricing Models and Honest Trade-Offs
- How to Choose a CRO Agency and What to Do Next
Why UK SMBs Are Losing Conversions Right Now
A business receiving 10,000 sessions would generate an implied order volume of roughly 218 orders at 2.18% and 194 orders at 1.94%. Those figures are calculated from the published Great Britain benchmarks in the same StoreBuilder data, and they show why a modest percentage-point movement matters to a retailer paying for every visit through Google Ads, SEO content or social campaigns.
| Period | Average UK Ecommerce Conversion Rate | Implied Orders per 10,000 Sessions |
|---|---|---|
| Q4 2023 | About 2.18% | About 218 |
| Q4 2024 | About 1.94% | About 194 |
For a Dorset retailer, the practical consequence is straightforward. You might be paying to promote garden products, food boxes, clothing or seasonal gifts, yet fewer visitors complete checkout. A hospitality venue may attract website visits but lose table bookings because the booking journey is unclear. A B2B service firm may rank for valuable searches and still miss enquiries because the form asks too much, the next step feels vague, or the page doesn't answer a buyer's main concern.
Traffic isn't the whole answer
Many owners respond to weaker sales by buying more traffic. That can work when the problem is demand, but it's wasteful when the existing funnel leaks at product pages, forms, baskets or payment. More visitors give the same friction more opportunities to reduce commercial return.
Privacy changes also make the picture harder to read. Attribution can be incomplete, returning visitors can be counted differently across platforms, and a blended dashboard can hide the fact that one campaign performs well while another sends low-intent traffic. You shouldn't approve a redesign or launch another acquisition campaign until the measurement is trustworthy.
Practical rule: Fix the highest-value leak before increasing the flow into it.
Start with three checks. Confirm the conversion event, compare performance by channel, and split mobile from desktop. Then inspect the pages that sit closest to a commercial action. For many small businesses, this work produces more useful decisions than another generic list of landing-page tips.
CRO isn't a magic substitute for a sound offer or accurate targeting. It is the discipline of extracting more value from visitors you already have, which becomes especially important when acquisition budgets are under pressure.
What Conversion Rate Optimisation Services Include
Conversion rate optimisation services should connect investigation, prioritisation, design, copy and testing to one defined commercial outcome. That outcome might be a purchase, qualified enquiry, booking request, phone call or product demonstration. A serious provider starts by checking how conversions are measured, including the denominator, channel split and device split, before proposing a redesign.
Sector context still matters. One UK benchmark set reports an overall ecommerce conversion rate of 1.93% in May 2026, compared with 1.76% a year earlier. Its range ran from 5.01% in arts and crafts to 1.20% in food and drink, with 1.53% for fashion and 3.00% for kitchen and home appliances. These figures come from UK ecommerce conversion benchmarks published by JW Digital. Use benchmarks as context, not as a target copied without thought. Product value, buying frequency, urgency and traffic intent change the answer.
The components that should earn their place
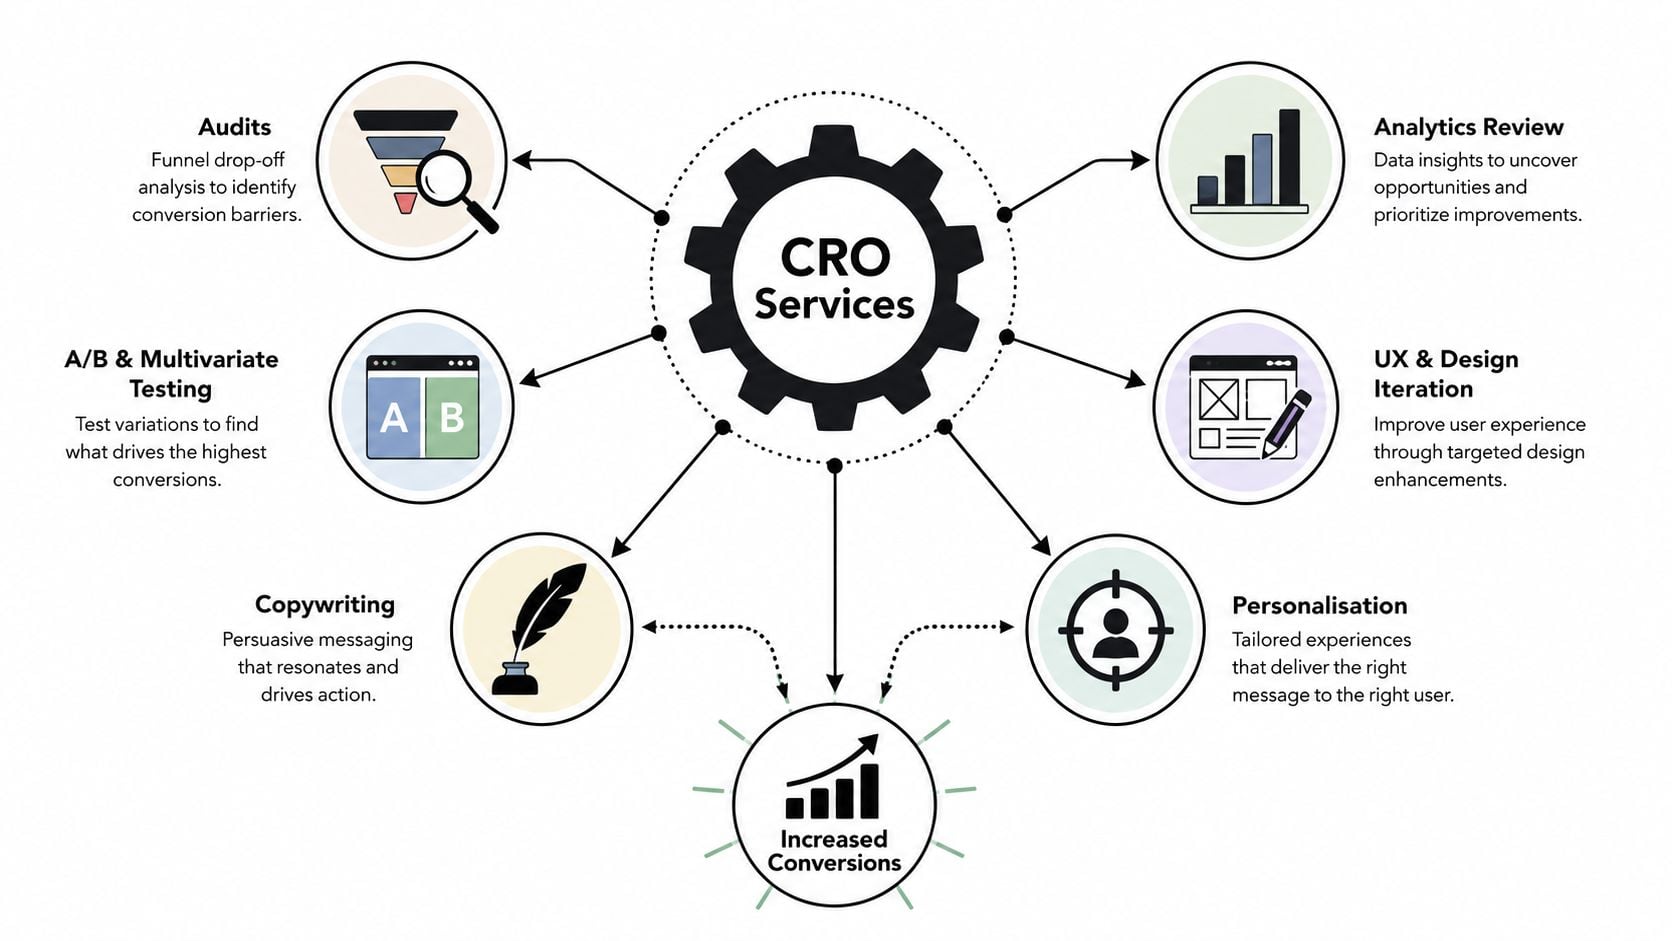
- Audits: Review analytics, funnels, forms, product pages, checkout steps, mobile layouts and technical friction. The deliverable should show where users leave and which issues deserve attention first.
- Analytics review: Check event definitions, attribution, device splits and conversion settings before interpreting performance. Incorrect tracking makes every later recommendation unreliable.
- Testing: A/B testing compares a control with a deliberate alternative. Multivariate testing examines combinations, but it requires sufficient reliable traffic and a precise question. It is not automatically better for a small Dorset site.
- UX and design iteration: Improve hierarchy, navigation, clarity and the visibility of important actions in response to observed problems. A fashionable visual refresh is not a CRO strategy.
- Copywriting: Address buyer questions at the point they arise. Good CRO copy clarifies the offer, reduces perceived risk, explains the process and makes the next action clear.
- Personalisation: Adapt content where audience needs differ. Small businesses should fix measurement and basic journeys before adding complicated personalisation rules.
Diagnostic first, redesign second
A credible engagement produces a hypothesis backlog. Each hypothesis links a user problem to a proposed change and a measurable outcome. If mobile visitors reach a form but abandon it after unnecessary fields appear, simplify the form and track completed qualified enquiries, not only button clicks.
For practical ideas aimed at service businesses, ViralRef CRO tips for service businesses offers useful background before a workshop. If the issue is wider usability rather than one isolated test, DesignStack's guidance on improving website user experience provides a relevant companion resource.
A redesign can be the right answer after the evidence supports it. It should not be the first recommendation from an agency that has skipped measurement, diagnosis and prioritisation.
The Denominator Problem Nobody Talks About
Conversion rate sounds like one clean number. It isn't. The denominator changes the story.
IRP Commerce explains that its market conversion rate uses sessions rather than visitors, because repeat visits count multiple times. A returning customer who visits several times can therefore affect a session-based rate differently from a visitor-based rate. If your analytics platform uses another definition, comparing the two figures without checking the denominator can make a healthy channel look weak or a weak channel look acceptable.
| Denominator | Reported Conversion Rate | What It Actually Tells You |
|---|---|---|
| Sessions | Purchases divided by recorded sessions | How often recorded visits produce a purchase, including repeat visits |
| Visitors | Purchases divided by users or visitors | How many people convert within the selected reporting period |
| Channel sessions | Purchases divided by sessions from one source | The effectiveness of a particular acquisition route |
| Device sessions | Purchases divided by sessions on one device type | Whether mobile or desktop journeys create more friction |
Segment before you diagnose
IRP's UK channel data reports referral traffic converting at around 3.6%, compared with around 1.2% for paid search and around 1.1% for social. Those figures are from the same IRP Commerce market data source. A blended rate can therefore hide important differences. A Dorset retailer running a promotion through Meta may see a lower overall rate because social visitors arrive earlier in the buying journey, not because every product page is failing.
Device splits create another distortion. Mobile users may browse, save products or return later on desktop, while desktop users may arrive with stronger purchase intent. That doesn't mean mobile performance is unimportant. It means you need to identify whether the mobile journey loses people at navigation, product presentation, form completion, delivery information or payment.
The practical sequence is simple:
- Lock the definition: Write down whether the primary rate uses sessions, visitors, leads or completed sales.
- Segment the data: Separate channel, device, landing page and new versus returning audiences.
- Check event quality: Confirm that the conversion event fires once, at the correct point, without duplicate or missing records.
- Compare like with like: Use the same denominator and segment definitions when reviewing periods or benchmarks.
- Only then prioritise tests: Spend experimentation budget where the data shows a genuine weakness.
DesignStack's funnel analysis guidance is useful for turning those stages into a practical review. A CRO services partner that skips this work is optimising a reporting artefact, not your customer journey.
How a CRO Engagement Runs From Audit to Test
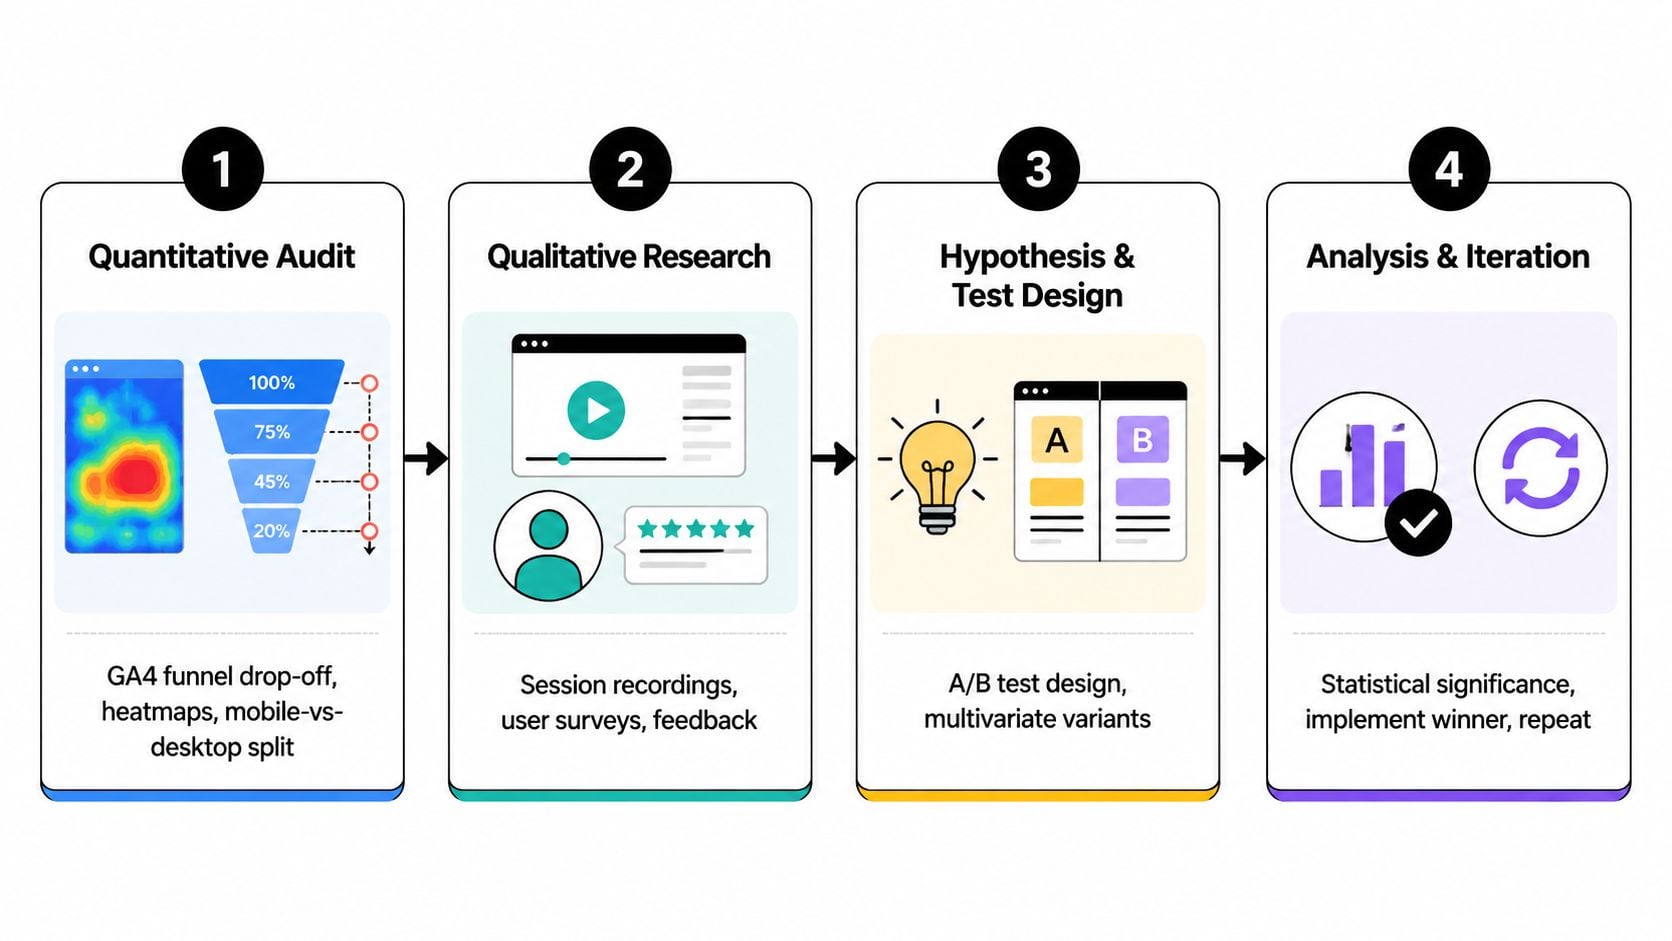
A sound CRO engagement follows a repeatable learning cycle. It starts with measurement quality, then moves to diagnosis, prioritisation and testing. An agency that begins with a favourite button colour is guessing.
Stage one, establish the quantitative picture
Start by checking GA4 funnel drop-off, landing pages, device performance, form events, basket behaviour and technical faults. Review the website analytics setup before trusting any report. Heatmaps show where users interact or stop scrolling. Session recordings expose hesitation, dead clicks and validation errors.
Mobile deserves an early review. UK-focused benchmark guidance gives a comparison rule: mobile conversion below 40% of desktop suggests structural UX friction, 40% to 55% is normal, and above 55% is strong, according to Futur Media's UK ecommerce conversion analysis. Use that relationship as a diagnostic signal, not a target detached from your own traffic and denominator.
A garden centre with desktop conversion at 2.8% and mobile conversion at 1.1% has a clear investigation priority. Check page speed, sticky navigation, product imagery, delivery details, filters, tap targets and checkout fields before debating headline wording.
Stage two, find out why people hesitate
Analytics identifies the point where behaviour changes. Qualitative research explains the reason. Review session replays, customer interviews, support tickets, sales notes and on-page feedback. A customer may abandon because delivery timing is unclear, a service buyer may distrust an unfamiliar process, or a form may request information that feels irrelevant.
Stage three, prioritise a backlog
Use an ICE or PXL scoring model to rank ideas by likely impact, confidence and effort. Tie each score to commercial value. A small improvement on a high-intent product or enquiry page can matter more than a dramatic change on a low-value page.
Document the hypothesis, audience, primary metric, guardrails, implementation owner and expected test duration. That record stops the team changing its rules after launch and gives a Dorset business something concrete to review.
Stage four, build, QA and learn
Create the variant, check analytics, test browsers and devices, confirm accessibility basics, then launch the experiment. Analyse the agreed primary metric and relevant segments before implementing, iterating or rejecting the idea.
A one-off test is not a CRO programme. A 12-week cadence with two simultaneous tests can create a useful learning rhythm when traffic and measurement support it. The cadence is a service recommendation, not a guarantee of results.
Watch the process in action before hiring anyone:
Each month, request three items: test results, a learnings log and the next-cycle hypothesis list. Use the guide to measuring website success to check whether the reported improvement connects to a verified business outcome. If the numbers cannot be audited, the agency's interpretation is doing too much of the work.
Proving ROI With Numbers a Dorset SMB Can Audit
A CRO business case is only as credible as its denominator. Before discussing uplift, agree whether the calculation uses sessions or visitors, then separate mobile and desktop performance, traffic channels, transactions and revenue. If analytics duplicates purchases or misses checkout events, the forecast is fiction.
One UK benchmark source reports an average Great Britain conversion rate of 3.4%, a median site rate of 2.35%, and a threshold of more than 3.2% for the top 20% of retailers. These figures are discussed in Behaviour Digital's UK ecommerce benchmark guide. Use them as reference points, not targets. Category, device mix, channel quality and measurement method determine what good means for your business.
Build the calculation from verified data
Use your analytics and accounts records together:
- Sessions: Confirm the agreed denominator and remove known tracking anomalies.
- Conversion rate: Divide completed purchases by that denominator.
- Orders: Multiply sessions by the rate.
- Revenue: Multiply orders by average order value.
- Contribution: Subtract fulfilment, product, advertising and service costs before calling the increase profit.
The guide to measuring website success can help you check whether the reported change connects to a verified business outcome. Record the baseline, date range, device split, channel mix and any tracking changes alongside the calculation.
A move from below the median to the median may matter commercially without adding traffic. The useful question is, “What verified extra contribution would this change create?” More clicks alone do not answer it.
| Benchmark position | Conversion rate | Implied gap vs median |
|---|---|---|
| Below median | Business-specific | Compare against 2.35% using the same denominator |
| Median site | 2.35% | Baseline reference |
| Top 20% threshold | Above 3.2% | Compare after normalising sector, device and channel |
The table uses the Behaviour Digital benchmark data cited above. It cannot support a fixed revenue forecast because your sessions, order value and margin are different.
For a Dorset business, auditability beats a polished uplift claim. Protect the original version, compare like-for-like periods, and judge the work against incremental gross profit and qualified enquiries, not engagement metrics that never reach the bank account.
Pricing Models and Honest Trade-Offs
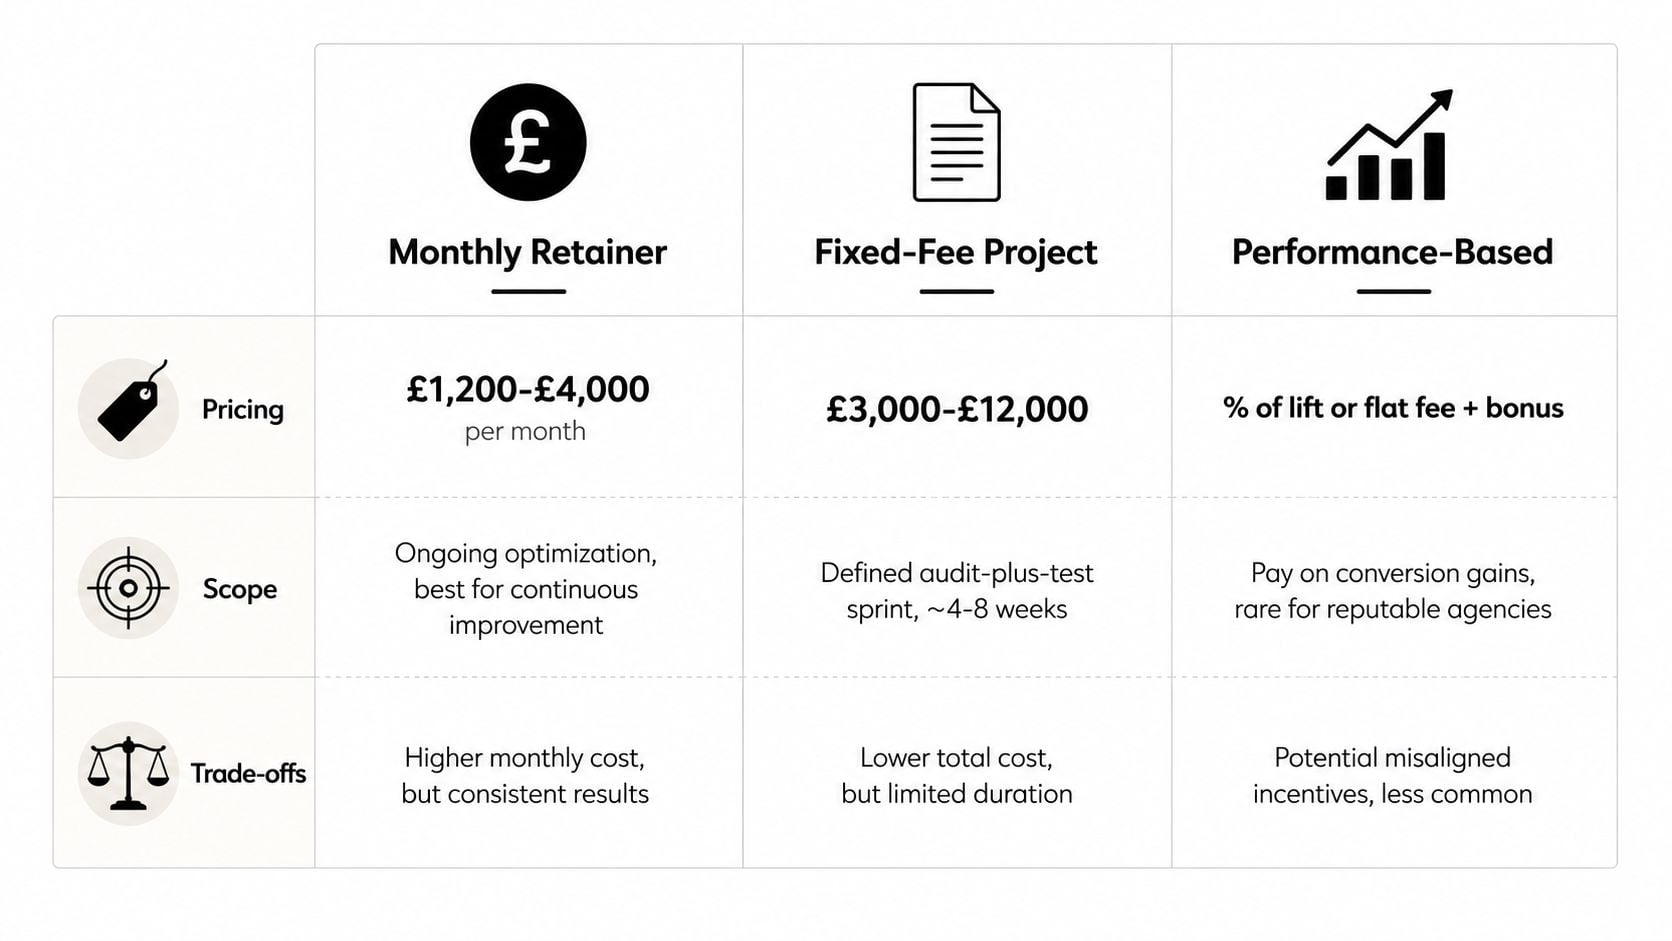
CRO pricing usually reflects the amount of research, design, development, analysis and testing an agency commits. The three common structures each solve a different purchasing problem. The right choice depends on traffic, internal capability and whether you need diagnosis or continuous execution.
Monthly retainer
A retainer suits a business with steady traffic and a backlog of testable hypotheses. You pay for an ongoing team that can research, prioritise, build variants, monitor performance and document learning.
The risk is drift. Some retainers become recurring reports with no shipped changes, especially when development time, decision rights and monthly deliverables aren't specified. Ask how many research hours, design iterations, implementations and analysis reviews are included, then agree what counts as a completed test.
Fixed-fee project
A fixed-fee engagement works well for a defined audit and prioritised roadmap. It gives a Dorset owner a clear boundary, a known deliverable and a way to assess an agency's thinking before committing to ongoing experimentation.
The trade-off is limited execution. A project can finish with a useful diagnosis but no one available to build, QA and measure the recommendations. Put implementation responsibilities in writing. A roadmap that never reaches the website has no conversion value.
Performance-based pricing
Performance pricing can appeal to a cash-conscious founder because part of the agency's fee depends on an agreed outcome. In practice, the contract needs careful definitions for attribution windows, seasonality, channel changes, refunds, repeat purchases and tracking failures.
Agencies also carry delivery risk, so a performance proposal may include a base fee, a higher minimum commitment or clawback terms. Disputes arise when the business changes pricing, increases paid traffic or launches a promotion during the measurement period.
Before signing: Define the denominator, primary conversion, baseline period, attribution window, implementation ownership and exit terms in plain English.
Don't choose a model because the headline price looks low. Choose the structure that makes the work visible and keeps incentives aligned.
How to Choose a CRO Agency and What to Do Next
Use a 30-minute sales call to test the agency's operating discipline, not its presentation skills. Ask these eight questions and expect direct answers:
- What is the baseline measurement method? Does it use sessions, visitors, transactions, leads or qualified opportunities?
- What evidence supports the first hypotheses? Ask whether the ideas come from analytics, recordings, customer research or opinion.
- Who will do the work? Confirm the named analyst, designer, developer and day-to-day contact.
- How will results be reported? Request the format, reporting cadence, primary metrics and treatment of failed tests.
- Which tools are required? Clarify the role of GA4, heatmaps, recordings, testing platforms and consent controls.
- How will tests be prioritised? Ask how impact, confidence, effort and commercial value affect the backlog.
- Who owns the artefacts? Confirm ownership of research, designs, code, experiment configurations and learning documentation.
- What are the contract exit terms? Check notice periods, minimum commitments, data access and handover obligations.
The visual checklist in this conversion rate optimisation service selection guide can help a non-technical owner organise the conversation. If you're also trying to make social traffic more useful, keep that work separate from CRO diagnosis and review relevant support such as social media management for startups as a distinct channel service.
Five red flags worth taking seriously
- Guaranteed uplift before an audit: No honest agency knows the size of an improvement before checking measurement, traffic and friction.
- Opaque reporting: A report that shows only wins hides the most valuable learning from failed tests.
- Packaged tactics before analytics access: A standard CRO bundle isn't suited to your customers or denominator.
- Outsourced experimentation: Ask who analyses the data and ships the changes.
- Long minimum commitments: A lengthy lock-in can protect an agency from accountability rather than support your business.
Prepare for the first call with read-only analytics access, recent sales or lead data, your main acquisition channels, a list of current website problems and the commercial action that matters most. Bring examples of lost enquiries, abandoned baskets or customer questions. Don't arrive ready to be sold a redesign. Arrive ready to test whether the agency can explain your funnel clearly.
For a Dorset business, request a free 45-minute conversion audit covering measurement, funnel structure and mobile UX. If the opportunity looks substantial, book a paid half-day workshop and challenge the proposed roadmap against your own upcoming traffic, promotions and sales priorities.
DesignStack can review conversion journeys alongside WordPress, ecommerce, SEO and website development requirements, with the scope agreed around the business problem rather than a generic package. Visit DesignStack to discuss a measurement-led CRO review for your Dorset or UK business and decide what should be fixed first.



Leave a Reply